· The Rapid Architect Team · AI · 11 min read
Using AI visually, a powerful and under-used tool.
How AI-Powered Visualization Transforms Business Understanding for Small Business Owners.

How AI-Powered Visualization Transforms Business Understanding for Small Business Owners
Podcast Discussion
The Hidden Cost of Complexity
Running a small business means wearing many hats. As a business owner, you’re simultaneously managing finances, overseeing software systems, tracking operational metrics, and making strategic decisions—often with limited time and resources. Yet the tools meant to help you understand these critical areas frequently make matters worse rather than better. Spreadsheets overflow with incomprehensible rows of numbers. System architecture diagrams look like spaghetti. Financial reports demand hours of interpretation. And by the time you’ve deciphered the information, the business context has already shifted.
This complexity creates a genuine bottleneck in business decision-making. Research suggests that executives spend nearly 30% of their time searching for information rather than acting on it. For small business owners operating with lean teams, this represents thousands of hours annually that could be spent on growth, strategy, or customer relationships.
The problem isn’t the data itself—it’s the presentation of that data. Our brains are fundamentally visual processors. We comprehend patterns, trends, and relationships far more quickly through visual representation than through raw numbers or technical descriptions. The challenge has always been creating these visualizations quickly enough and accurately enough to be useful in a fast-moving business environment.
Enter artificial intelligence. Over the past two years, AI has become capable of generating meaningful visualizations, interpreting complex data structures, and translating technical information into visual representations that humans can immediately grasp. For small business owners, this capability is genuinely transformative.

Understanding AI-Powered Visualization
AI-powered visualization isn’t simply about generating prettier charts. It’s fundamentally about intelligent translation—taking complex information and converting it into visual forms that reveal meaningful patterns, enable faster understanding, and support better decisions.
Traditional visualization tools require manual setup. You specify which data points to include, choose a chart type, configure axes, and hope the result communicates what you intended. This process is time-consuming and, frankly, underutilized in small business settings because it requires technical knowledge and dedicated time.
AI-powered visualization tools operate differently. By analyzing the underlying data, understanding context, and applying principles from data science and design, AI systems can automatically recommend optimal visualizations, highlight anomalies, extract key insights, and even predict which visual representations will best serve your understanding of a particular dataset.
Consider financial data as an example. A traditional approach might mean generating a profit and loss statement—rows and columns of numbers organized by category and time period. An AI system analyzing the same data might instantly recognize patterns: which revenue streams are growing fastest, which expense categories are trending unexpectedly upward, how your business compares to historical trends, and which metrics demand immediate attention. It can then present this understanding through cascading visualizations that start with the big picture and allow you to drill down into details only when you need them.
The underlying technology combines natural language processing (understanding what you’re asking), data analysis (determining what the numbers actually mean), and intelligent design (choosing how to present that meaning visually). The result is a compressed communication pathway between raw business information and human understanding.
Financial Data: From Overwhelming to Insightful
For most small business owners, financial management represents one of the greatest sources of stress and confusion. The typical approach involves quarterly reviews of financial statements prepared by accountants, supplemented by scattered spreadsheets tracking various metrics. By the time you understand what happened last quarter, you’re already halfway through the current one.
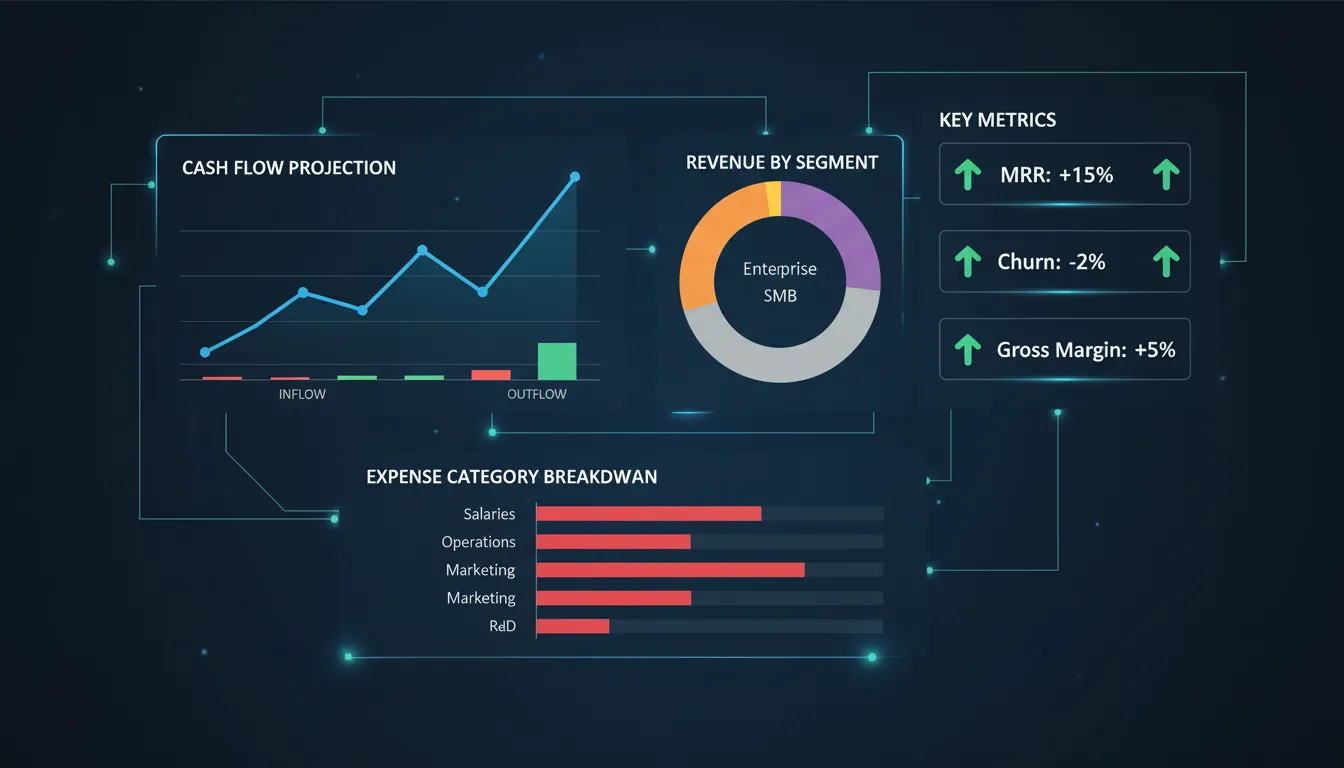
AI-powered financial visualization changes this equation. Instead of reviewing comprehensive but static reports, you can interact with dynamic visual representations of your financial picture. An AI system might automatically generate visualizations showing your cash flow trajectory over the next three months, flagging periods where you might face cash crunches. It could visualize your revenue by customer segment, immediately revealing which segments are most profitable and which are consuming disproportionate resources. Expense visualizations can highlight the 80/20 principle in action—showing you that perhaps two or three vendors represent 60% of your costs, or that labor represents a much higher percentage of operating expenses than you realized.
More sophisticated AI systems can analyze relationships between financial metrics. They might discover that customer acquisition costs have increased 15% while customer lifetime value has decreased 20%, presenting this correlation visually in ways that make the underlying business problem immediately apparent. Rather than needing to manually construct pivot tables and run calculations, the AI identifies these relationships and visualizes them for you.
One particularly valuable application involves scenario analysis. Need to understand the financial impact of hiring two more employees? Investing in new equipment? Expanding to a new market? An AI system can generate visual projections showing how these decisions might affect your cash position, profitability, and key financial ratios—allowing you to evaluate options before committing resources.
The psychological impact here shouldn’t be underestimated. Financial anxiety often stems from information scattered across multiple systems and from a sense of not truly understanding your business’s financial health. Comprehensive, intelligible visual representations of your financial situation provide both clarity and confidence.
Software and System Architecture: Making the Invisible Visible
For business owners who’ve had to manage or evaluate software development, few experiences are more frustrating than trying to understand what developers are actually building. Developers speak in abstractions—microservices, APIs, database schemas, asynchronous processing—while business owners think in terms of features and user experiences. This translation gap means you often can’t effectively evaluate whether you’re getting what you paid for, whether the technical direction makes sense, or what the actual business impact of technical decisions will be.
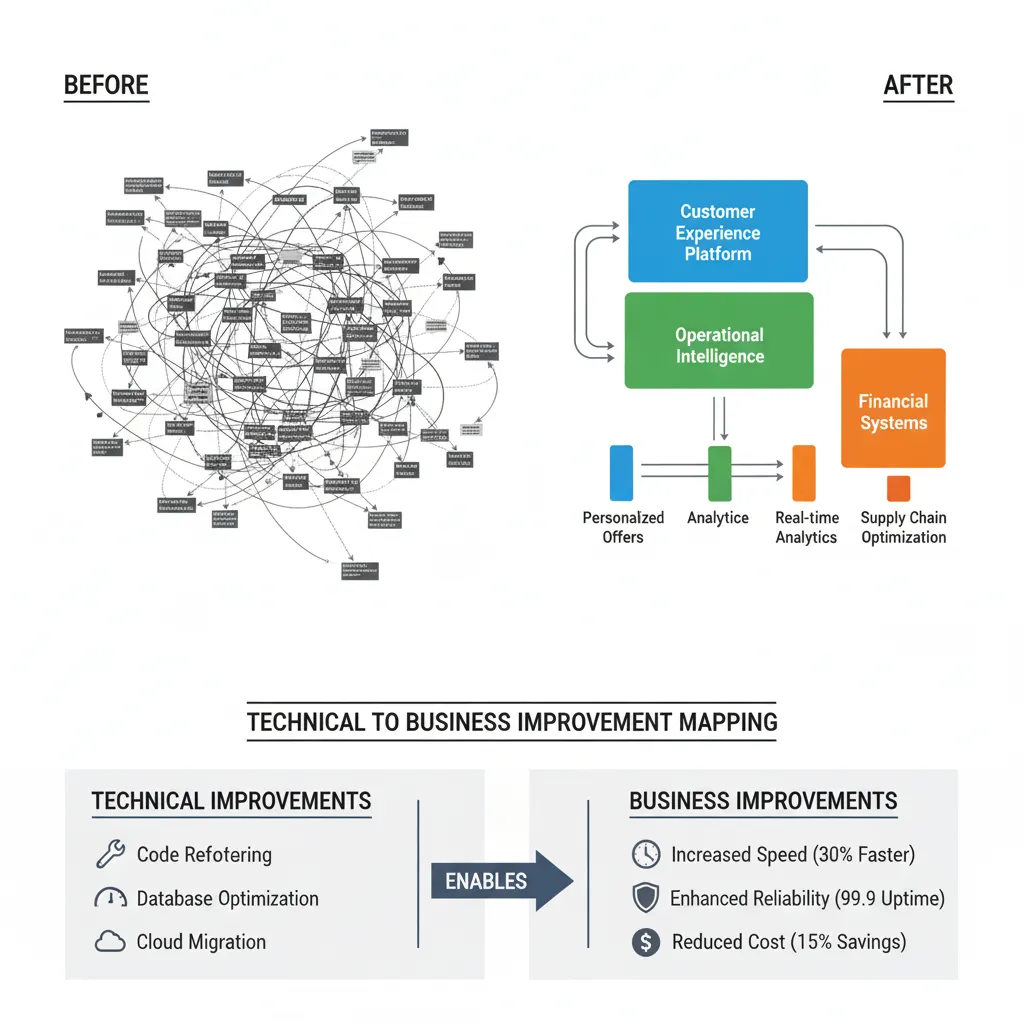
AI visualization tools are beginning to bridge this gap. By analyzing code repositories, system diagrams, and technical documentation, AI can generate visual representations of software architecture that communicate to non-technical stakeholders what the system actually does and how its pieces fit together.
More importantly, AI can help visualize software changes. When a development team reports that they’ve “refactored the authentication system” or “optimized the database queries,” these descriptions are technically accurate but business-meaningless. An AI system analyzing the same changes might visualize what actually happened: the authentication system now handles 10x more simultaneous users without degradation, the database optimization reduced page load times by 40%, or the refactoring reduces technical debt by making future changes to this component 50% faster.
Software change visualization also supports better decision-making around technical debt. Developers often argue that addressing technical debt is important, but business owners struggle to understand why fixing something that already works should take priority over building new features. Visualization can help. An AI system might show how technical debt compounds over time—a visualization demonstrating that as technical debt increases, the time required to implement new features increases exponentially, or that bug rates increase as technical debt accumulates. This transforms technical debt from an abstract concept into a clear business problem.
Another valuable application involves visualizing deployment pipelines and system reliability. Rather than receiving reports about uptime percentages and incident counts, you might see visualizations showing your system’s actual reliability history, the correlation between code changes and incidents, and how various infrastructure investments have impacted system stability. This enables business owners to make genuinely informed decisions about infrastructure spending.
Beyond the Primary Categories: Operational and Strategic Visualization
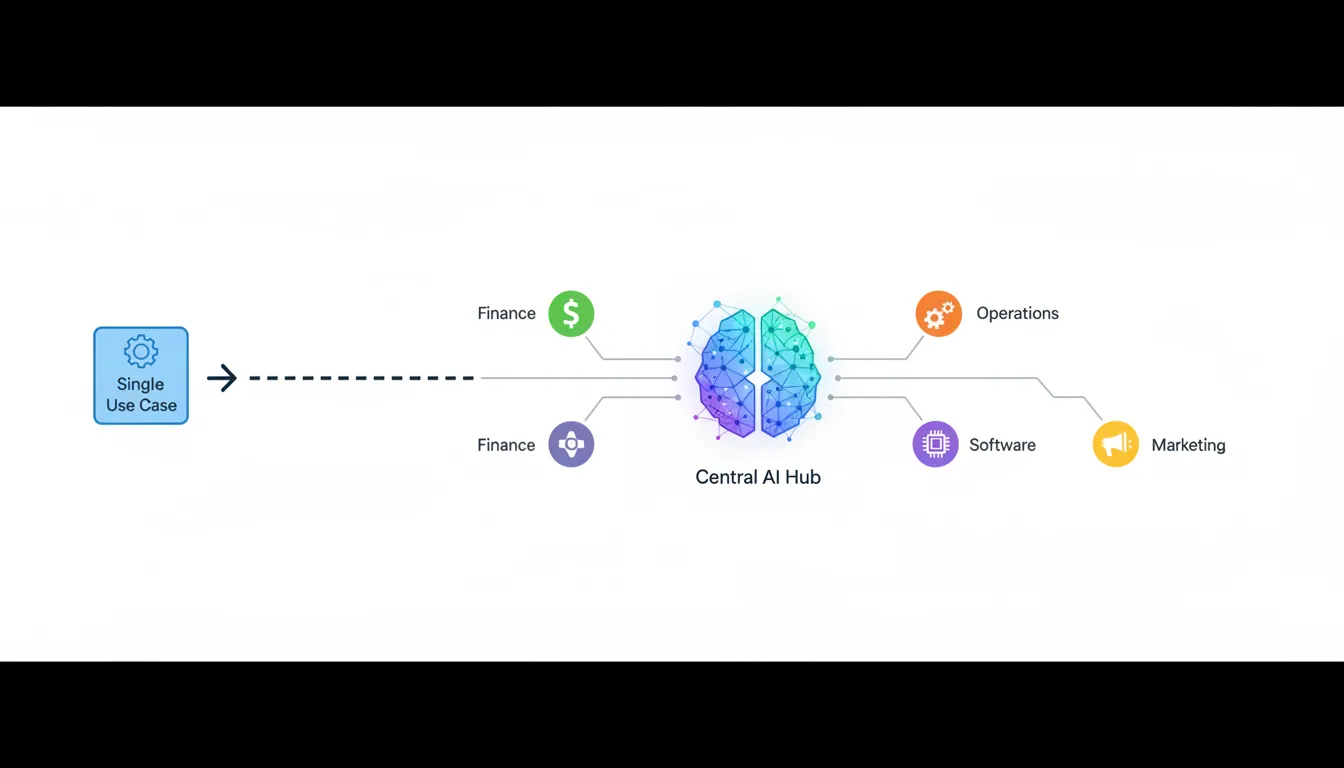
While financial data and software changes represent primary use cases, AI visualization can illuminate virtually any aspect of business operations that deals with complex information.
Customer data offers one example. Rather than generating customer lists and transaction histories, AI can visualize your customer base in multidimensional ways—showing which customer segments are most valuable, which are most engaged, which have the highest churn risk, and how various customer attributes correlate with business outcomes. You might discover that customers acquired through one marketing channel have twice the lifetime value of customers from another channel, or that customers from certain geographic regions require disproportionate support resources.
Operational metrics and supply chain data represent another category. Manufacturing and service-delivery businesses deal with countless data points—production schedules, quality metrics, supplier performance, inventory levels. AI visualization can help these business owners see patterns they otherwise wouldn’t notice: that quality issues spike when production occurs during certain shifts, that specific suppliers have reliability issues that aren’t immediately obvious from transaction data, or that inventory levels aren’t actually correlated with demand in the way business managers expected.
Project tracking and team performance data can be visualized in ways that support better management without micromanagement. Rather than reviewing spreadsheets of tasks and time tracking data, you might see visualizations showing which projects are genuinely on track, which are at risk, how different team members’ productivity correlates with various factors, and where bottlenecks in your processes actually exist.
Marketing and sales data visualization can reveal the true customer journey in ways that raw analytics dashboards often obscure. An AI system might visualize how customers actually move through your sales funnel, which stages present the biggest drop-off, how various marketing tactics correlate with ultimate sales outcomes, and which types of customers are most valuable to acquire.
Implementing AI Visualization in Your Small Business
You might be wondering how to actually bring these capabilities into your business. The good news is that you don’t need to hire data scientists or implement complex infrastructure. Several categories of tools are emerging specifically designed for this purpose.
First, there are general-purpose AI platforms that can generate visualizations from data you provide. Systems like Claude, ChatGPT with data analysis capabilities, and other AI assistants can analyze datasets you share with them and generate visualizations that illuminate key patterns and relationships. While these tools require you to actively ask questions about your data, they’re accessible and affordable.
Second, there are purpose-built business intelligence tools increasingly incorporating AI capabilities. Traditional BI platforms like Tableau, Power BI, and Looker are adding AI-powered features that automatically suggest relevant visualizations based on your data, identify anomalies and outliers, and explain what various metrics actually mean. These tools have become significantly more accessible to small businesses over the past few years.
Third, there are specialized tools building AI visualization specifically for certain domains. Financial management platforms are incorporating AI-powered financial visualization. Development teams are beginning using AI tools that automatically visualize code changes and system architecture. Project management platforms are adding AI-powered visualization of project health and team performance.
The most practical path forward depends on your specific needs, technical comfort level, and budget. Starting small often makes sense. Pick one area of business complexity that genuinely frustrates you—whether that’s financial understanding, software project management, customer analysis, or operational visibility. Experiment with AI visualization tools in that area. Learn what’s possible. Then expand to other areas.
One important consideration: data quality matters. The principle of “garbage in, garbage out” applies to AI visualization as to all data analysis. If your underlying data is inaccurate, incomplete, or poorly structured, visualizations won’t solve the problem—they’ll just present bad data more clearly. Before implementing AI visualization, it’s worth investing in getting your data house in order.
The Broader Implications: Decision-Making in the AI Era
Perhaps the most significant implication of AI-powered visualization extends beyond any single business function. Throughout human history, access to information has determined who has advantage. Twenty-first-century business is increasingly about the speed and quality of decision-making, and decision-making speed is fundamentally constrained by how quickly business leaders can understand their situation.
AI-powered visualization compresses this time. Instead of requiring hours or days to gather, process, and understand information, business owners can grasp key patterns and relationships in minutes. This shift enables more frequent, better-informed decisions. It supports faster adaptation to changing market conditions. It allows small business owners to operate with the informational sophistication that previously required larger teams and more resources.
This represents a genuine democratization. A solo founder might use AI visualization to monitor customer acquisition, financial health, and product usage patterns with the same sophistication that would have required hiring a business analyst at a traditional company. A small team managing multiple projects might achieve project visibility that previously would have demanded a dedicated project office. This capability leveling extends to all business domains where information comprehension currently creates bottlenecks.
Conclusion: Making Complexity Work For You
The most successful small business owners share a characteristic: they understand their business deeply. They know where money is made and spent. They understand their customers at a granular level. They see operational bottlenecks clearly. They make decisions based on information rather than intuition.
Yet this understanding traditionally required either dedicated analytical talent or personal involvement in detailed data analysis—both luxuries that small business owners often can’t afford.
AI-powered visualization changes this equation. By automatically translating complex information into visual forms that human brains can immediately process, AI helps business owners achieve sophisticated understanding without requiring specialized analytical skills or disproportionate time investment.
Your financial picture becomes transparent. Software investments become understandable. Operations become visible. The information assets your business generates become truly useful assets that inform better decisions and drive business growth.
In an era where competitive advantage increasingly depends on decision-making speed and quality, this capability isn’t a nice-to-have enhancement to business management. It’s becoming essential infrastructure for operating effectively.
The question isn’t whether to adopt AI-powered visualization—it’s when and where to start.